OpenSports has introduced pivot tables in the Reporting Center to make analyzing your data faster and easier. Millions of rows of registration, attendance, or payment data become easy-to-read summaries in seconds. Compare, group, and track performance instantly to guide your next move.
How pivot tables help admins
See demand at a glance → which events fill up fastest.
Track your finances clearly → compare membership vs. drop-in revenue.
Spot participation trends → see attendance patterns by season.
Monitor cancellations → identify where most refunds are happening.
With these insights, you’ll know when to add more sessions, adjust pricing, and fine-tune your programs.
What pivot tables do
Summarize big data: Quickly see total signups per program.
Flexible grouping: Organize by event, date, membership, or discount.
Custom comparisons: Compare member vs. non-member attendance.
In-depth insights: Drill down from overall trends to individual transactions.
To build your first pivot table:
Go to an event report and click Create Pivot Table.
Add a Filter to focus on the data you want.
Choose a Value (like Revenue or # Attendees).
Add a Row Dimension (e.g., Event Title).
Optionally add a Column Dimension (e.g., Month) to compare side by side.
The four main sections
When you click Create Pivot Table, you’ll see four main sections:
Filters
Filters control which rows of data are included in your table. Click Add Filter, to view two main categories: Order Filters and Event/Program Filters.

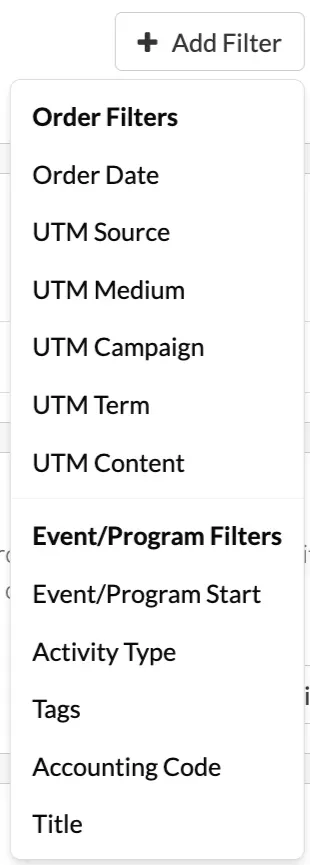
Order Filters allow you to analyze based on order details and marketing tracking codes, such as order date, UTM source/medium/campaign/term/content.
Event/Program Filters focus on event setup and categorization, letting you filter by event start date, activity type (e.g., soccer, pickleball), tags (e.g., beginner, tournament), accounting codes, or event titles.
Values
Values are the numbers or metrics that get calculated and displayed in your pivot table. These fields represent what you want to measure, such as counts, revenue, or refunds. They are aggregated automatically (e.g., summed, counted, or averaged) based on your row and column dimensions.
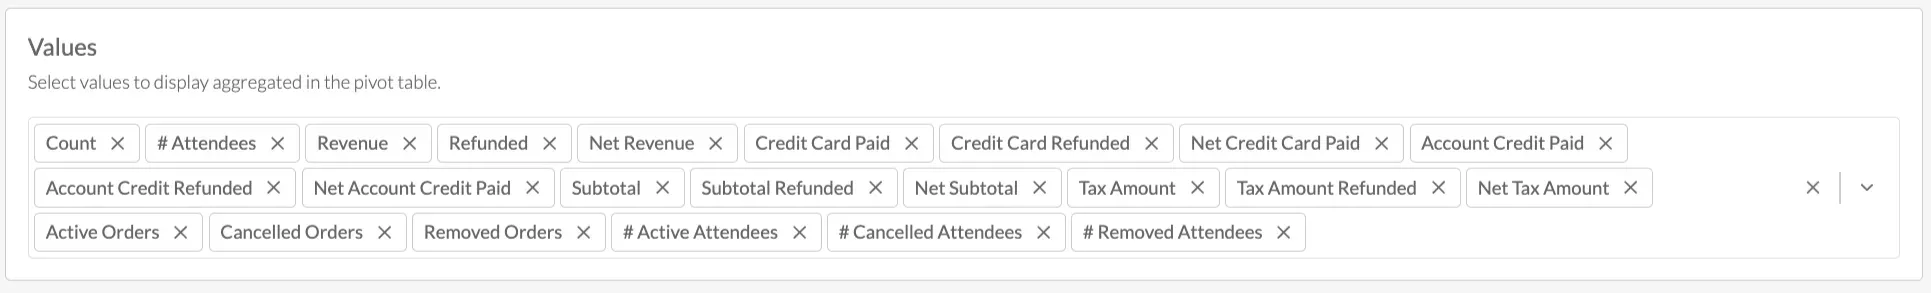
Common options include:
- Attendance metrics – # Attendees, # Active Attendees, # Cancelled Attendees.
- Financial metrics – Revenue, Net Revenue, Subtotal, Tax Amount, Net Credit Card Paid.
- Order metrics – Active Orders, Cancelled Orders, Removed Orders.
Row Dimensions
Row Dimensions control how your data is grouped vertically in the pivot table. Each row dimension creates a category (or set of categories) that organizes your selected values (e.g., revenue, attendees, orders) into meaningful groups.
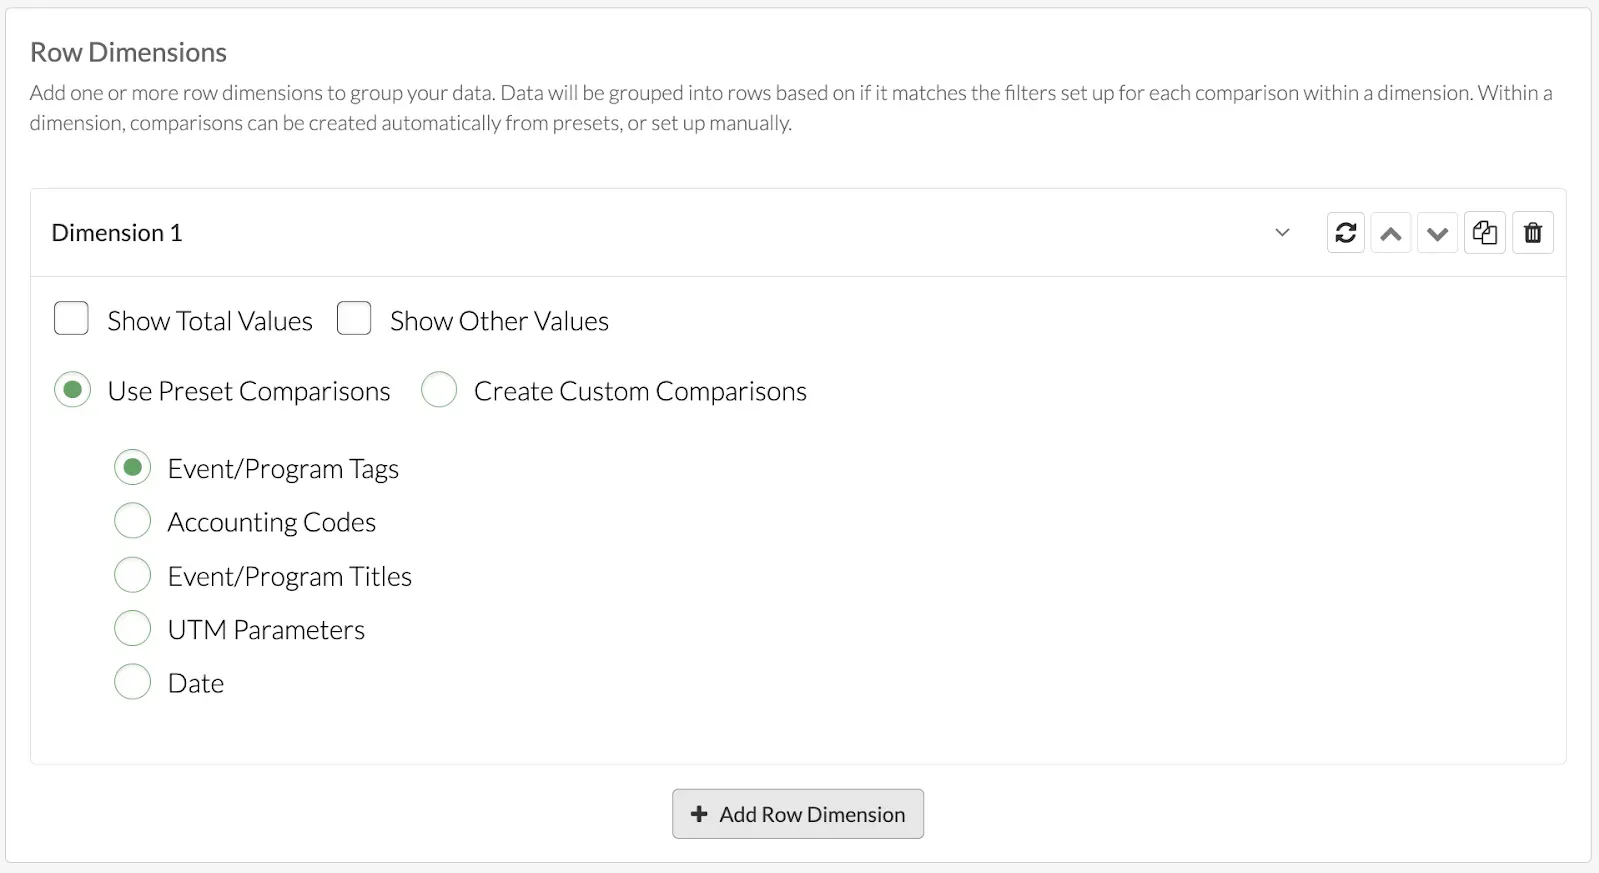
Instead of seeing one big total, row dimensions let you break data down into comparisons, such as by event tag, accounting code, or date, so you can analyze trends and differences.
Column Dimensions
Column Dimensions control how your data is grouped horizontally in the pivot table. Each column dimension creates side-by-side categories across the top of your table, allowing you to compare values (such as revenue, attendees, or orders) across different groups.
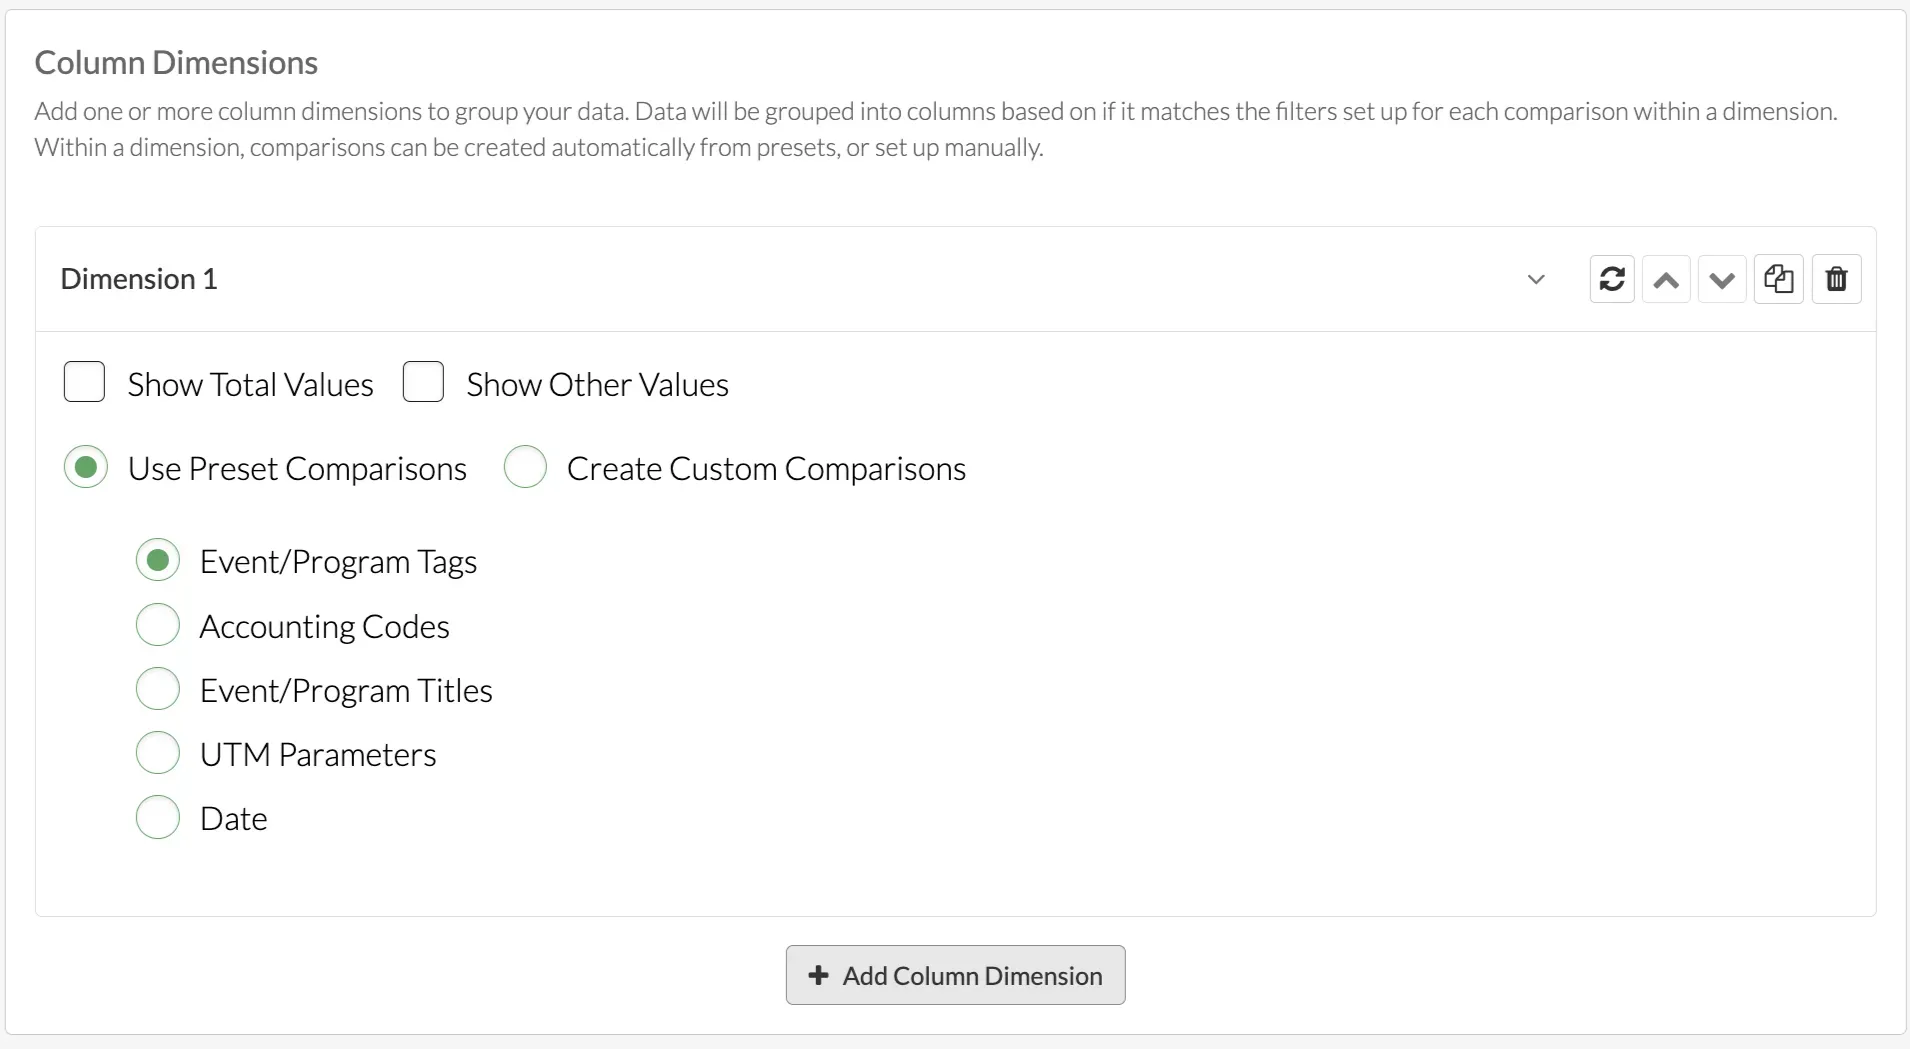
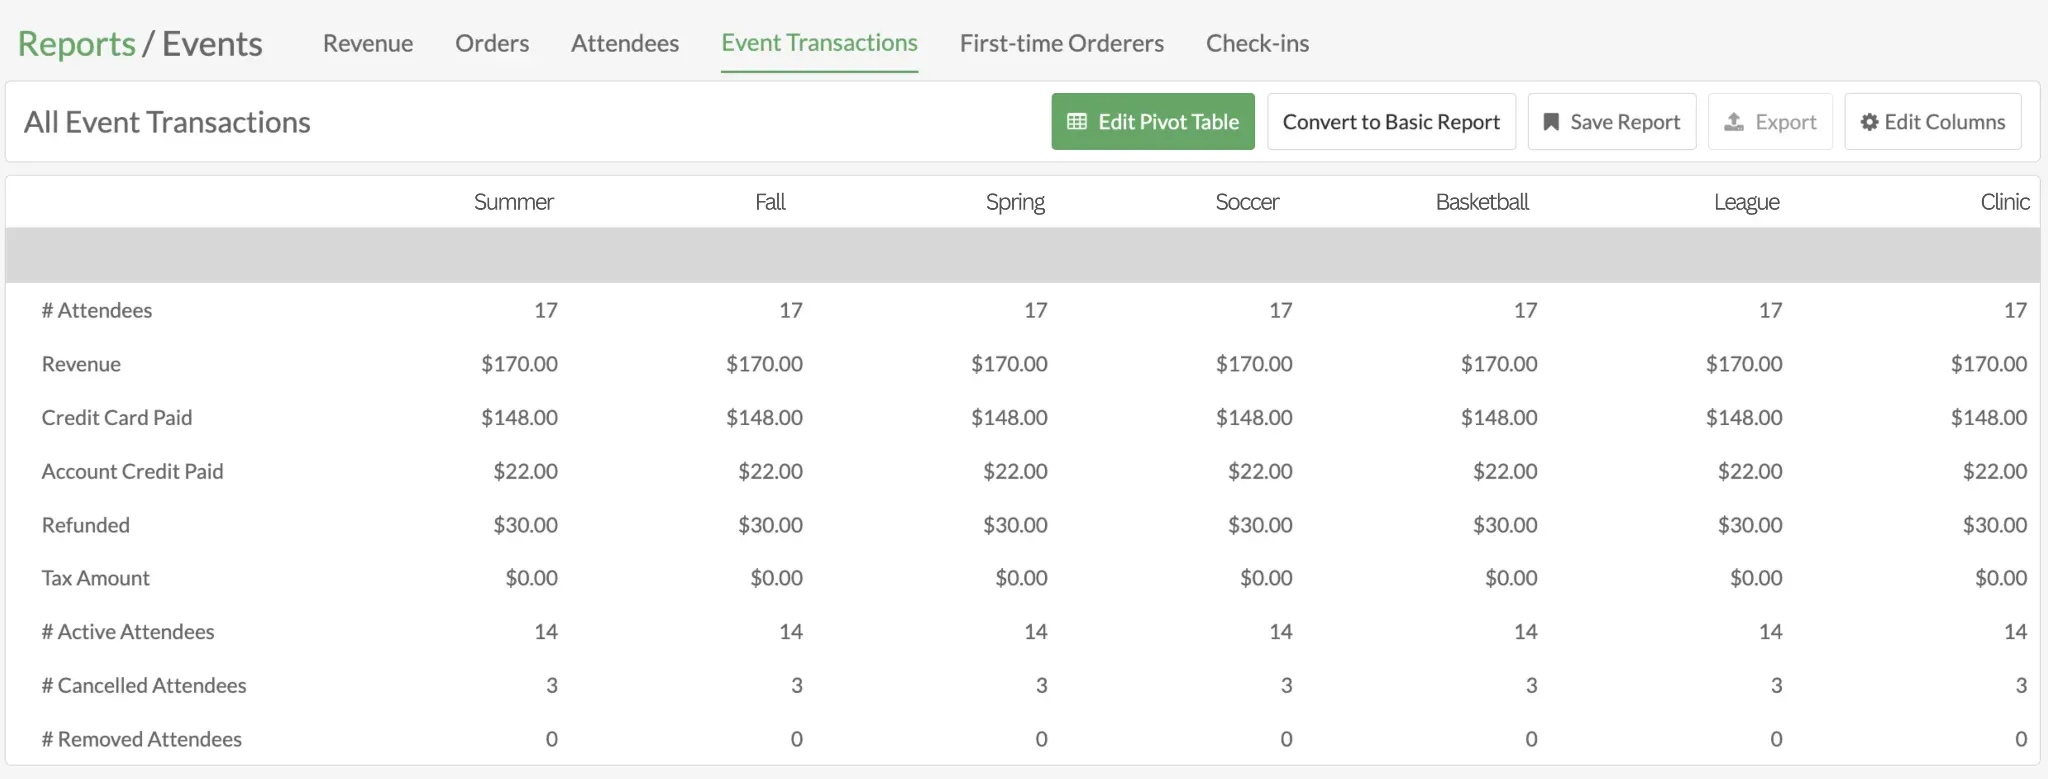
By pairing column dimensions with row dimensions, you can create a matrix-style view that highlights trends, comparisons, and relationships in your data.
Practical Example: Program Tag Performance
- Filter → Event/Program Start = current season.
- Values → Registration Count.
- Row Dimension → Tags (e.g., Beginner, Intermediate, Tournament).
- Column Dimension → None.
- Result: See which types of programs are attracting the most players.
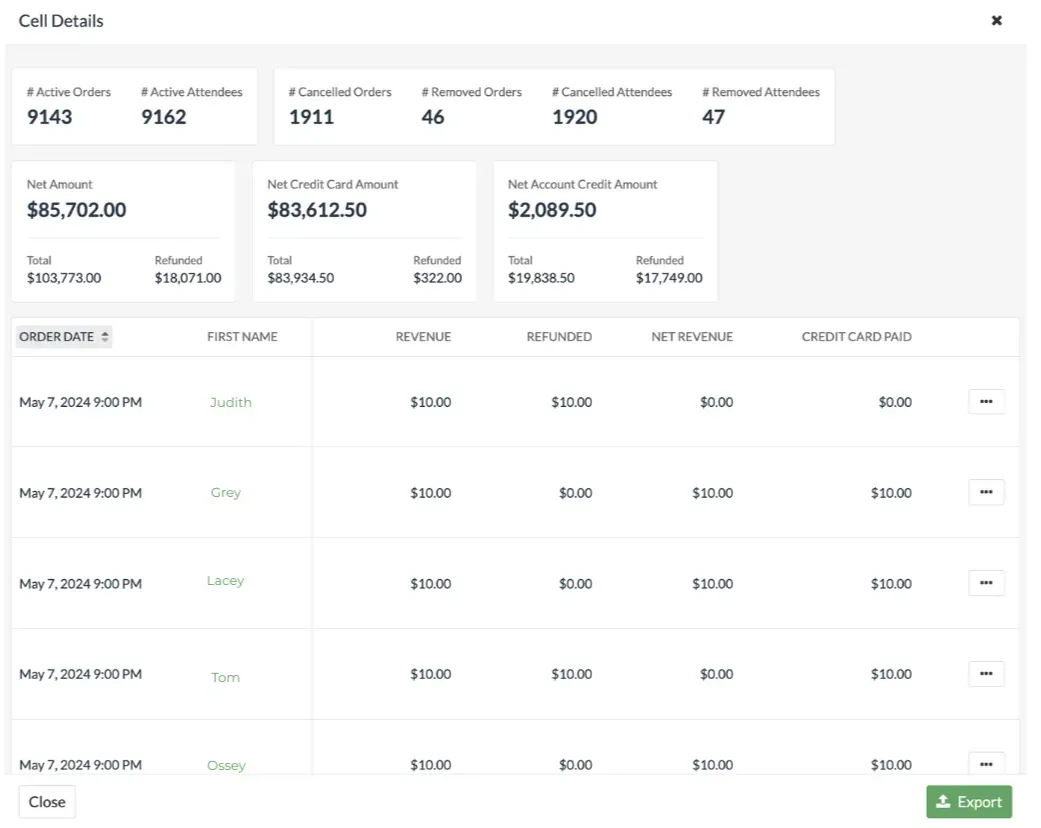
Cell Details
Every number in a pivot table is clickable. Selecting a cell opens a Cell Details popover with the individual records behind that total. You can Export the details into a CSV for deeper analysis.
Why it matters
Instead of juggling multiple reports, pivot tables put everything in one place. Attendance, payments, refunds, and campaigns can be compared side by side, giving you a complete picture of your group’s performance at a glance.
Questions? Send them our way: support@opensports.net