When you run your sports and fitness organization through OpenSports, you get access to a comprehensive dashboard that allows you to track important metrics. This article will show you how to generate custom, exportable reports through your dashboard.
Anatomy of the Reports Dashboard
- Navigate to your Reports dashboard from your group home page (Click Dashboard → in left-hand menu, click Reports).
- The following types of reports can be generated:
- Revenue: view how much you have earned per event
- Orders: view orders per user (in dollar amounts)
- Event Transactions: view transactions (orders, refunds, and registrations) per event
- First-time Orderers: generate a list of users who placed their first order with your group
- Check-ins: view the total number of event check-ins (i.e., event attendance) and no-shows, as well as a breakdown of user check-ins and no-shows for paid and free events
- Top Discounts: summary of group discounts that were redeemed most often
- Discounts Redeemed: view all orders where a discount code was redeemed
- Membership Payments: if you offer memberships to your group, view all revenue earned from memberships
- New Members: track group growth by viewing all members who have joined your group
- Account Credit Transactions: view all refunds issued per user, with a breakdown of refunds made to a group account credit and to a user's credit card directly
All of the above reports can be set up for custom time periods and exported as .csv files.
How to generate a report: Revenue example
Below are the steps for how to generate a report through the dashboard. We use the example of a Revenue report, but you can easily generate other types of reports by following the same workflow.
- Navigate to your Reports dashboard from your group home page (Click Dashboard → in left-hand menu, click Reports).
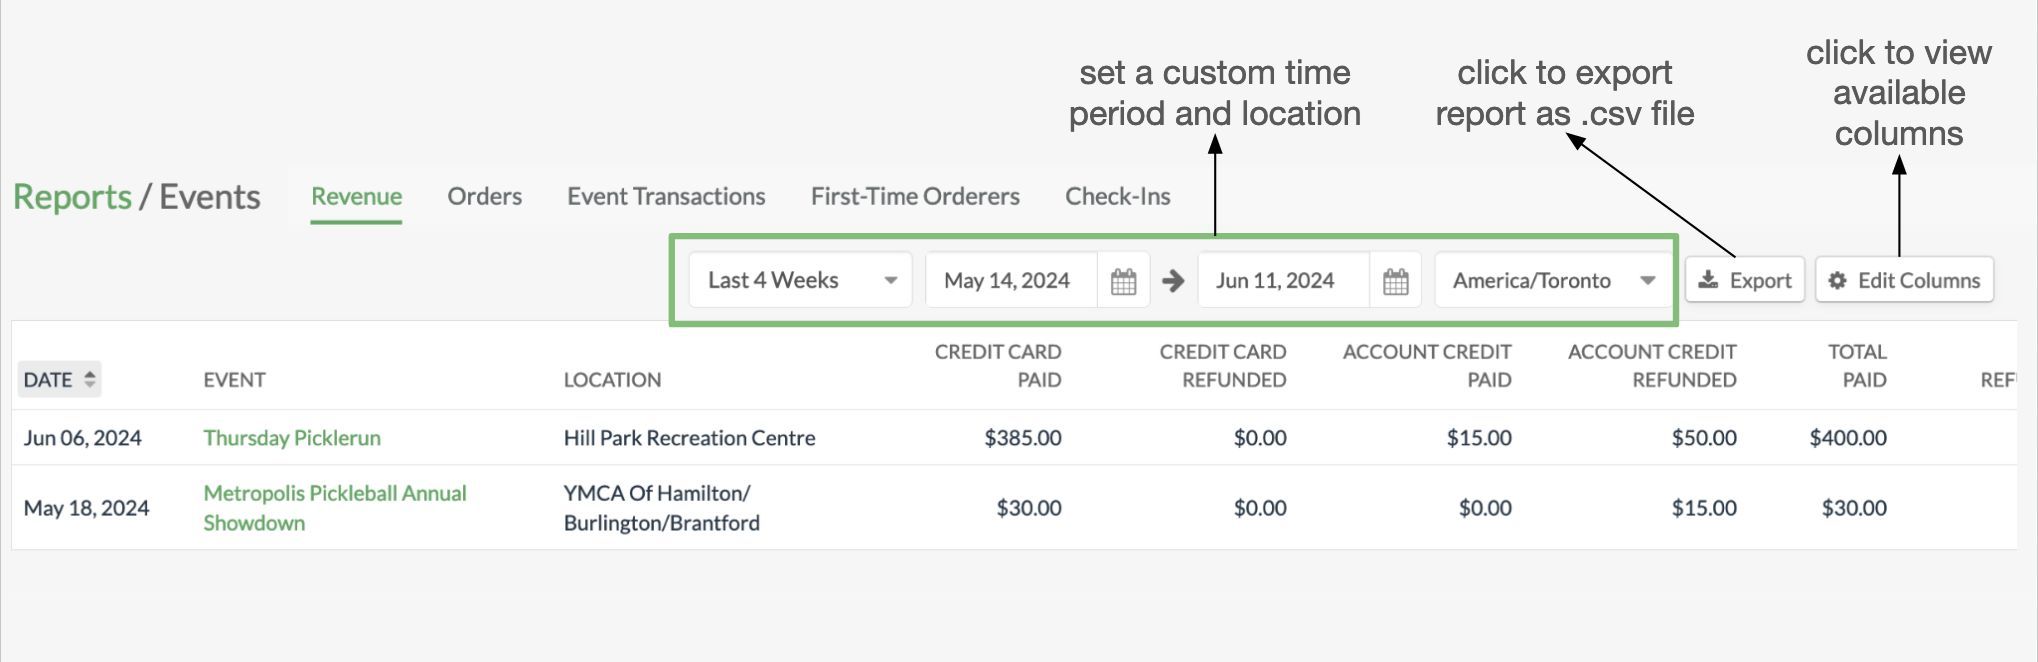
- Click on Revenue (or the type of report you want to generate).
- To define a specific time period for which to see data:
- Select a time period from the drop-down list (Last 7 Days, Today, Last 4 Weeks, Month to Date, Last 12 Months, Quarter to Date, Year to Date) OR
- Set a custom time period by entering the start and end dates.
- Select the group geographical location from the drop-down list. This ensures that the correct time zones are used when restricting data by time period.
- You can view and select all of the available report columns (i.e., types of data) by clicking the Edit Columns button.
- To view all columns included in the report, scroll to the right.
- Reports can be sorted by date (or user name, depending on the report) in ascending or descending order.
- To view the specific event (or user in other report types), click on the ↗️ arrow at the end of the row.
- When you are ready to export your report, click on Export. The file will be downloaded as a .csv file, which can be opened using Excel, Google Sheets, Apple Numbers, and other software programs.
Questions? Send them our way: support@opensports.net